AI Trading in Crypto: What Automation Can and Cannot Do
A grounded look at where automation removes friction — execution discipline, monitoring, consistency — and where it cannot substitute for judgement, context or risk control.
AI Futures Intelligence · Interactive preview with simulated data
Discover AI-powered futures strategies, automate your trading workflow, and make more informed decisions in fast-moving crypto markets.
Crypto Market Monitor
Simulated data
AI Trading Copilot
Turn complex market signals into structured insights, strategy ideas, and clearer trading decisions.
Bitcoin is consolidating near a key technical zone. Short-term momentum has cooled while the higher-timeframe structure remains constructive, and volume is running below its 30-day average. Monitor volume expansion and volatility before considering a directional strategy.
Positioning leans long but is not crowded, and the demonstrative funding rate stays close to neutral. Crowded positioning usually shows up as a stretched funding rate alongside rising open interest.
Illustrative analysis
Neutral territory. Neither overbought nor oversold.
Histogram positive but flattening over the last three sessions.
Price holds above the 50-period and 200-period references in this dataset.
Price sits close to the middle of the tracked range, which lowers the reward profile of a chase entry.
A moderate reading. Trend strength above 75 typically means moves extend; below 40 usually means choppy, mean-reverting conditions where breakout strategies struggle.
Illustrative indicators
Demonstration scenarios
Demo responses only. No AI model is called and no account data is read.
Automated Futures Trading
Explore rule-based automation and AI-assisted strategy tools designed for different market conditions.
Range execution engine
Executes grid trading rules inside a price range you define, placing and managing orders as price moves between levels. Well suited to sideways markets and poorly suited to sustained trends.
Directional momentum engine
Identifies market regime from the trend indicators you configure, then applies your entry, exit and stop-loss rules. Designed for trending conditions where holding a direction pays.
Scheduled entry engine
Splits entries across a schedule or price ladder and tracks the average entry, with preset exit rules. Leverage magnifies the same averaging that makes the approach feel comfortable.
Analysis & optimisation workspace
Suggests strategy structures, proposes parameter ranges, lets you test them against simulated history, and summarises the risk profile before you decide anything.
No live execution
Strategy Lab
Explore strategy scenarios, review historical performance, and practise with simulated funds.
Simulated leverage of 5x keeps the maintenance-margin buffer in a moderate band.
| Strategy | Sim. Return | Max Drawdown | Win Rate | Profit Factor | Trades |
|---|---|---|---|---|---|
| Trend Following | +18.6% | 14.2% | 41.0% | 1.34 | 64 |
| Grid Strategy | +9.4% | 6.1% | 68.0% | 1.52 | 122 |
| Mean Reversion | +7.1% | 9.8% | 57.0% | 1.21 | 89 |
Not a performance record
Risk Management & Transparency
Make risk visible before making a trading decision.
| Move | Price | Position P&L | Return on margin | Status |
|---|
Estimated values
Decide the loss you are willing to accept and where that decision becomes invalid. Sizing follows the stop, not the other way around.
Leverage changes your distance to liquidation, not the market’s direction. Track utilisation as positions move against you.
Know the price at which the position is closed involuntarily, and how much margin is left once that level is reached.
Two-factor authentication, login alerts and device review are the expected baseline for any trading account. Configure them before funding.
Automation keys should be scoped to trading only, with withdrawals disabled and an IP allow-list applied.
Use a withdrawal allow-list, keep balances proportionate to trading needs, and verify destination addresses out of band.
Personal data should be limited to what the service needs, with clear retention rules and an exportable account history.
Maker, taker and funding costs should be stated before a strategy is activated, because they materially change small-margin outcomes.
Latency, engine availability and maintenance windows belong in public view, since automation depends on them directly.
Research Journal
Explore the ideas, market mechanics, and strategies shaping digital asset trading.
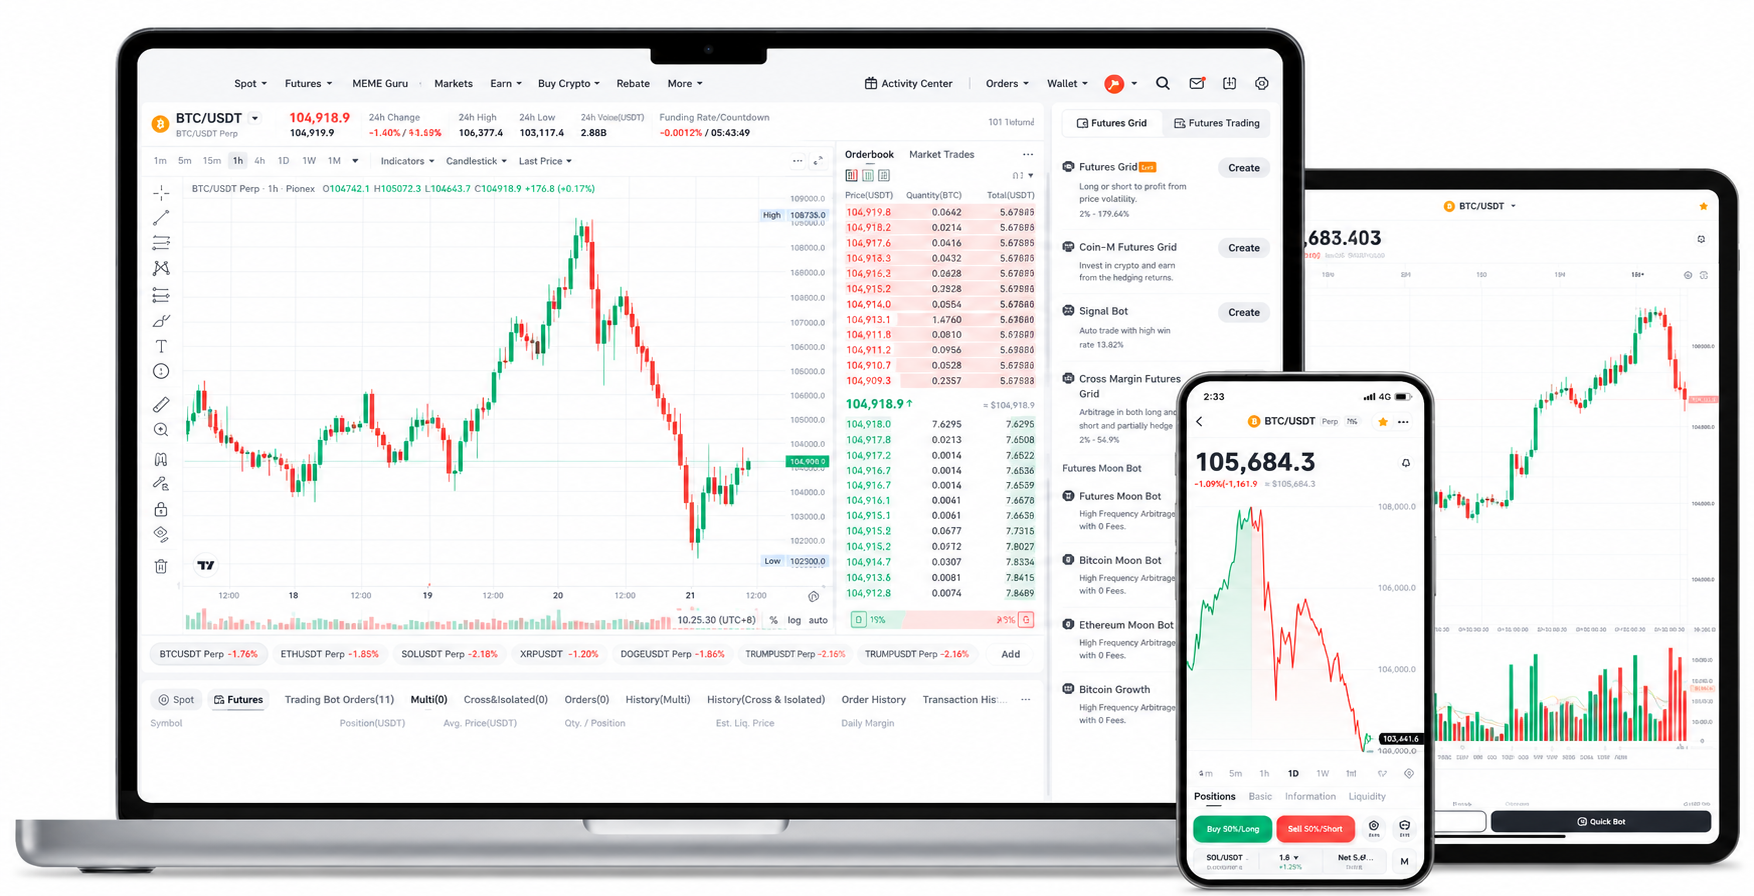
Explore how market data, technical indicators, strategy rules, historical testing, and risk controls work together in a structured trading workflow.
A grounded look at where automation removes friction — execution discipline, monitoring, consistency — and where it cannot substitute for judgement, context or risk control.
Perpetual contracts have no expiry, so funding payments tether them to spot. Learn how the rate is calculated, when it is paid, and why it shifts with positioning.
One harvests range-bound chop, the other needs directional movement. Compare their trade frequency, drawdown behaviour and the regimes each tends to struggle in.
Leverage does not change the market, it changes your distance to liquidation. Work through margin, maintenance requirements and the arithmetic behind a 10x position.
From data selection to fee, slippage and funding assumptions, see how a testable hypothesis becomes a result you can interpret — and how backtests mislead.
Volatility is information, not a buy or sell instruction. Learn to separate expansion from random noise using range, volume and realised-volatility context.
Getting Started
Discover smarter workflows, test your ideas, and build a more disciplined approach to digital asset markets.
FAQ
It means using software to organise market data, surface patterns and support a decision you still make yourself. Typical inputs include price structure, volatility, volume and positioning. The value is consistency and speed of analysis; the limitation is that no model knows what happens next, and any suggestion can be wrong. Treat AI output as structured context, never as an instruction.
You define rules: a market, a price range or trend filter, order sizes, stop conditions and a maximum position. A bot watches the market and applies those rules repeatedly without hesitation. It does exactly what it is told, including in conditions you did not anticipate, which is why limits such as maximum position size and hard stops matter more than the entry logic.
No. Nothing in leveraged crypto markets can guarantee a profit, and any product claiming otherwise should be treated with suspicion. Bots can improve consistency and remove emotional decisions, but they also execute losses just as reliably. Past simulated or historical performance tells you how a rule set behaved under one set of conditions, not how it will behave next month.
Demo trading uses simulated balances and simulated fills, so mistakes cost nothing and you can rehearse a workflow. Live trading adds real money, real fees, real funding payments, real slippage and real liquidation. The biggest difference is behavioural: a strategy that feels comfortable on a demo account can be difficult to hold once the loss is your own capital.
Leverage scales your position without scaling your margin, so it shortens the distance between your entry and the liquidation price. At 100x, roughly a 1% adverse move can consume the entire margin. Higher leverage also means funding costs apply to a larger notional and that normal market noise can trigger liquidation even if your longer-term view turns out correct.
Yes, and you should. A backtest applies your rules to historical data to show how the logic would have behaved, and a demo run applies them forward with simulated money. Both are useful for finding broken assumptions. Neither is proof, because backtests are sensitive to the period chosen, and optimistic assumptions about fills, fees and slippage are the most common way a promising result turns into a real loss.
Three cost layers matter. Maker and taker fees are charged each time you trade, and high-frequency strategies pay them constantly. Funding is paid every eight hours on perpetual positions and can work for or against you depending on the rate. Slippage is the gap between the price you expect and the price you get, and it widens in fast markets when stops trigger. On small margins, fees and funding can easily outweigh the edge a strategy appears to have.